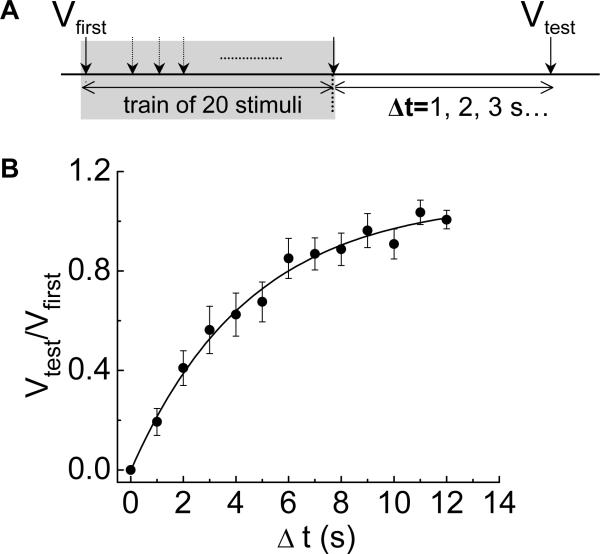
Fig. 3.
Time-dependent recovery from synaptic rundown. (A) Diagram of the protocol used to measure the time course of recovery from synaptic rundown. A conditioning train of 20 stimuli at 10 Hz was used to cause fEPSP rundown. A single test stimulus applied at various intervals after the conditioning train was used elicit a fEPSP to determine the extent of recovery. Δt is the time interval between the last stimulation in the conditioning and the test stimulus. Recovery is expressed as the ratio of the amplitude of the fEPSP caused by the test stimulus (Vtest) vs. the amplitude of the fEPSP caused by the first stimulus (Vfirst) in the conditioning train. (B) The time course of recovery was fit by a single exponential function with a τ = 7 ± 1.7 s. Data points are the mean ± SEM of observations made on 14 neurons.

