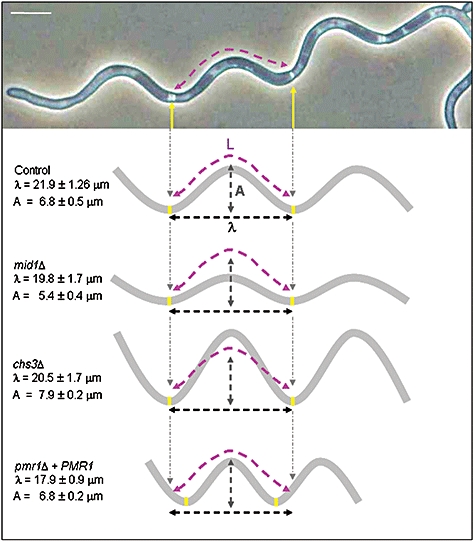
Fig. 5.

Variation in the morphology of sinusoidal curves in gene deletion mutants compared with the control strain. Hyphal growth was induced on 4% solid agar medium at 37°C and the wavelength (λ) and amplitude (A) of sinusoidal waves were determined using Openlab software (means ± SD, n = 100 helices in three independent experiments). Bar = 10 μm.
