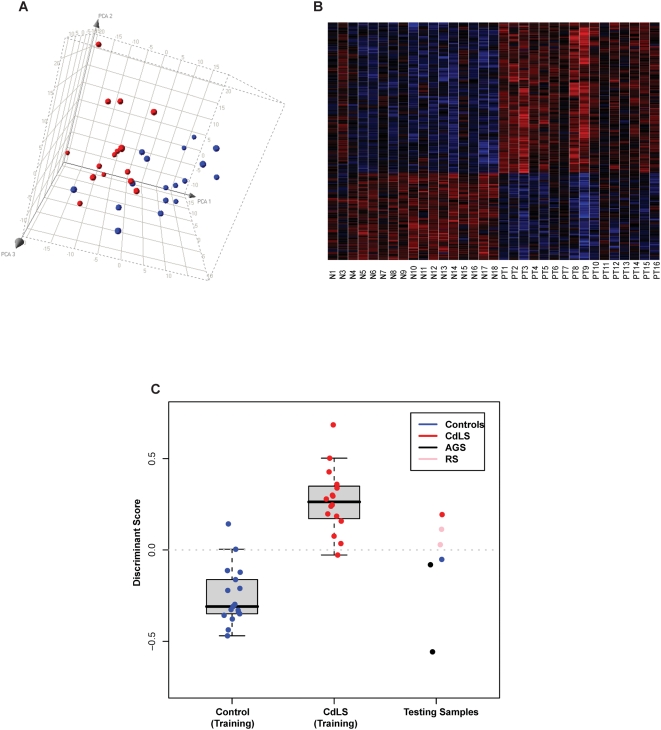
Figure 1. Classifications of the 33 training samples by gene expression.
(A) Unsupervised clustering of 17 healthy controls (blue dots) and 16 severe CdLS probands (red dots) by principle component analysis (PCA) of the 27,995 probe sets actively transcribed in LCLs. The separation between the training groups indicates that controls and probands have different gene expression patterns. (B) Heatmap showing that the identified 420 probe sets (FDR<0.01) are expressed dramatically differently between CdLS probands (PT) and healthy controls (N). Red represents genes that are upregulated and blue represents genes that are downregulated. The left 17 columns represent control samples, and the right 16 columns represent proband samples. Rows display gene expression levels. (C) Nearest centroid classifications of the 33 training samples and six testing samples. Among the training samples, two healthy controls and one CdLS proband were misclassified after Leave-One-Out cross validation. Among the testing samples, CdLS probands and two RBS probands were classified into CdLS group whereas the one healthy control and two probands with AGS were classified into the control group.

