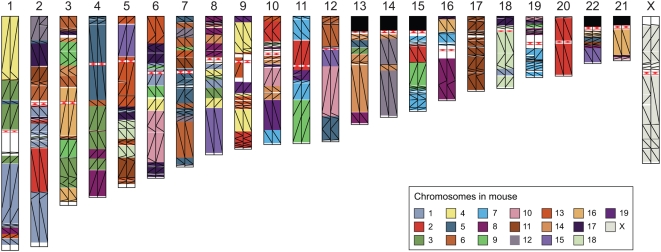
Figure 3. A graphical representation of conserved synteny relationships.
The chromosomes of human Build 36 are painted with segments of conserved synteny ≥300 kb long with mouse MGSCv3 (left) and Build 36 (right). Colors indicate mouse chromosomes (see legend bottom right), while lines indicate orientation (top left to bottom right is direct, top right to bottom left is inverted). White regions are not covered by alignments forming a segment ≥300 kb. Red triangles are human centromeres. Note that all undirected blocks (regions of identical color) are identical between the two mouse builds except a region at the centromere of human Chromosome 9, which is itself an artifact in the MGSCv3 map. However, several areas of orientation change, some quite small, can be seen.

