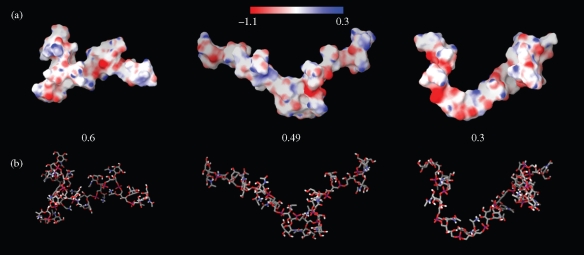
Figure 3.
Molecular electrostatic potential surfaces (a) and stick representation (b) of WTA substituted with d-Ala (ratios GlcNAc:d-Ala are 0.6, 0.49 and 0.3). Three-dimensional models were obtained by conformational search and consisted of 5000 steps of Monte Carlo torsional sampling after initial model building and minimization. The scale at the top of the figure indicates colour-coded values of the electrostatic potential mapped onto the molecular surface: blue indicates positive and red negative potential, within the range −1.1 to 0.3.

