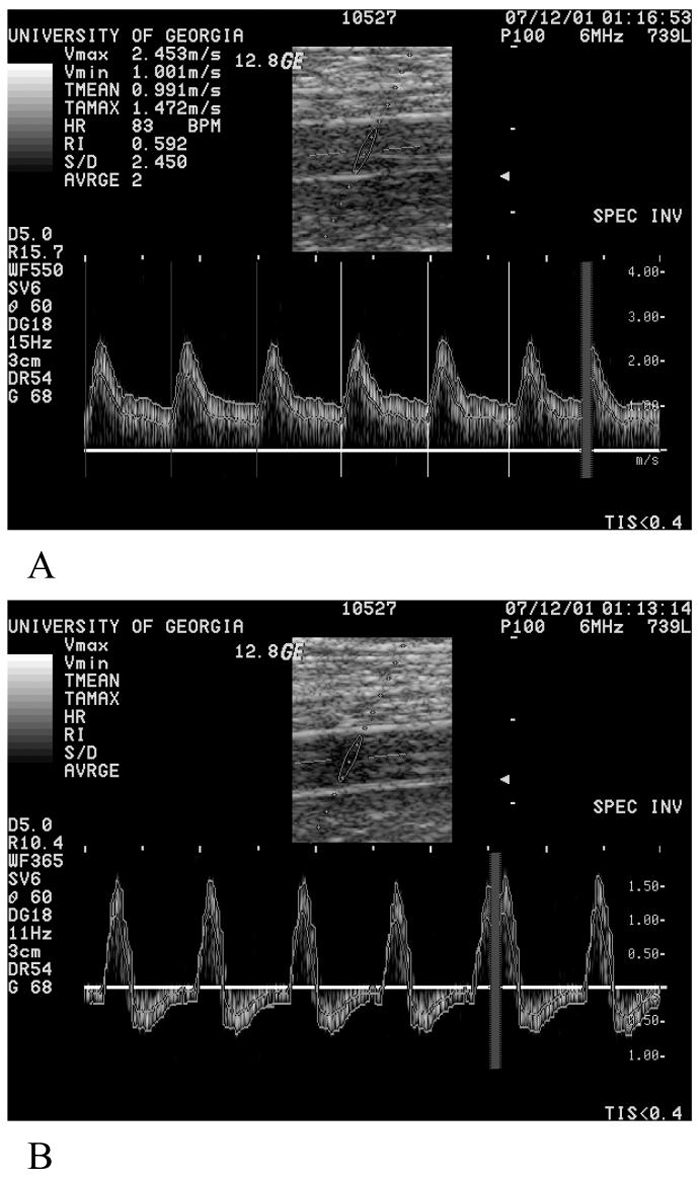
Figure 1.
A. Blood velocity patterns 7 seconds after exercise with the cuff deflated to 0 mm Hg. This was the peak flow response for this subject. B. Blood velocity patterns 254 seconds after exercise with the cuff inflated to 90 mm Hg. Velocity data was traced by hand from the lines picked on the machine. Vmax = 1.57 m/s, Vmin = -0.68 m/s, TMEAN = 3.9 cm/s and TAMAX = 3.6 cm/s.

