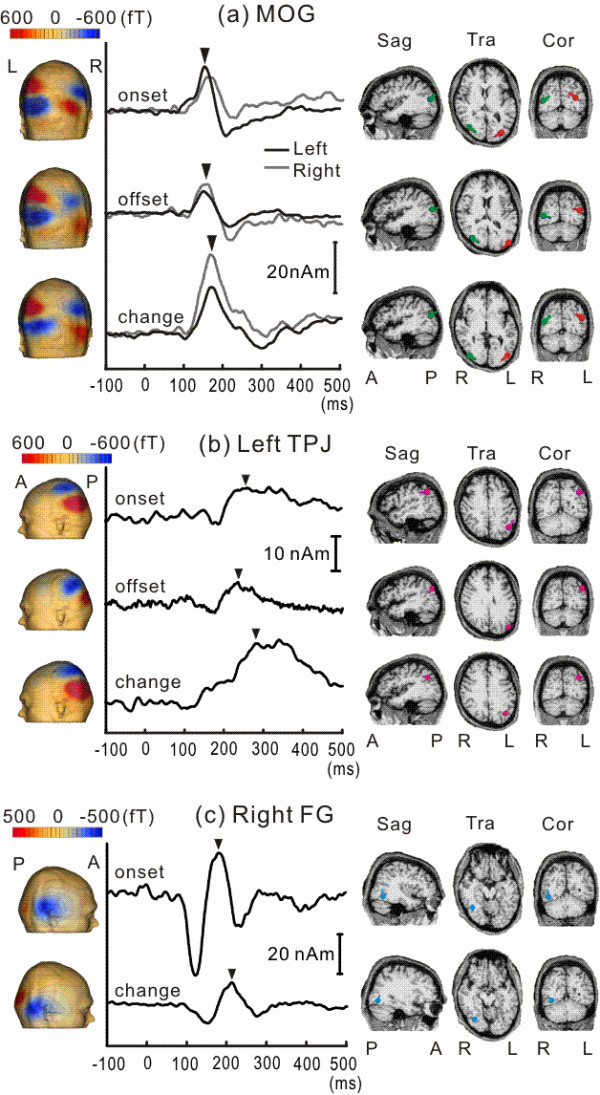
Figure 3.

Comparison of the isocontour map, time course of source activity, and locations of dipoles among Onset, Offset and Change for each cortical activity. Note the very similar activation profiles of MOG and TPJ activity among the three conditions.
