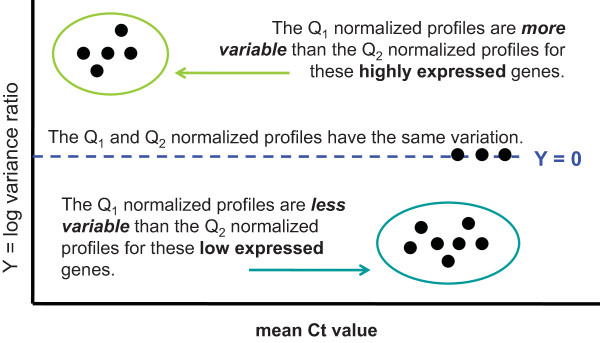
Figure 2.
Exemplar graph to clarify the interpretation of Figure 3. The graph presents a visual pairwise comparison between two normalization algorithms Q1 and Q2 on the same data set. For each gene, we calculate the variance of its Q1-normalized expression profile and its Q2-normalized expression profile and plot the log2-ratio of this variance on the y-axis where Y = log2 [Q1-normalized: Q2-normalized]. A gene's log variance ratio is plotted against its expression (mean Ct value) on the x-axis. The regions where the data points fall in the graph give us an indication of which normalization algorithm produces noisier data and whether there is a differential bias in expression for genes most affected by this noise.

