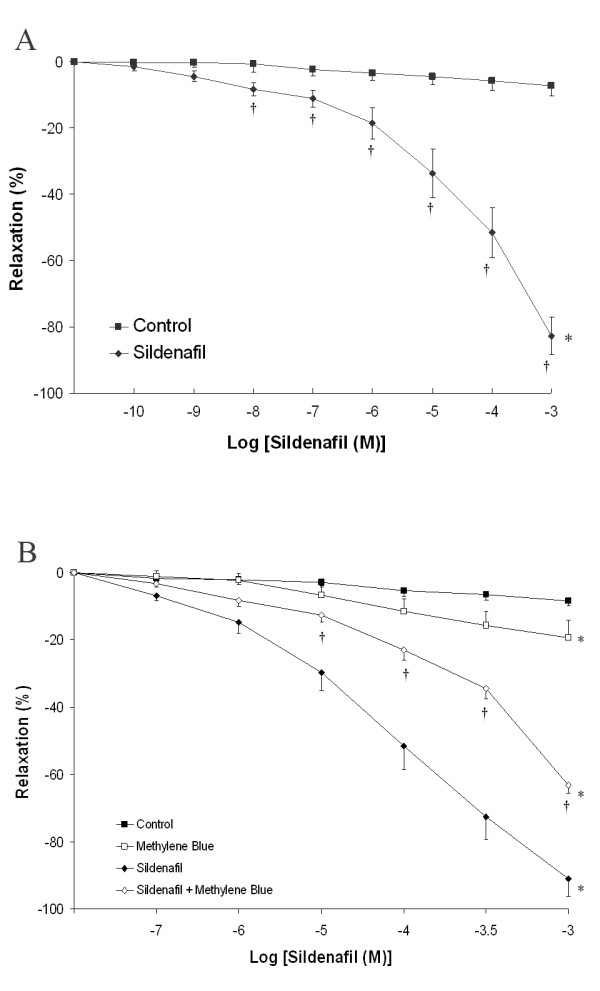
Figure 4.

Panel A: Cumulative concentration-response curve for sildenafil citrate from 10-10 M to 10-3 M compared to control (vehicle) at a submaximal U46619 induced contraction. *P < 0.05 compared to baseline. † P < 0.05 compared to control. Panel B: Cumulative concentration-response curve for sildenafil citrate from 10-7 M to 10-3 M compared to vehicle at a submaximal U46619 induced contraction, in the presence and absence of methylene blue. *P < 0.05 compared to baseline. † P < 0.05 compared to sildenafil citrate.
