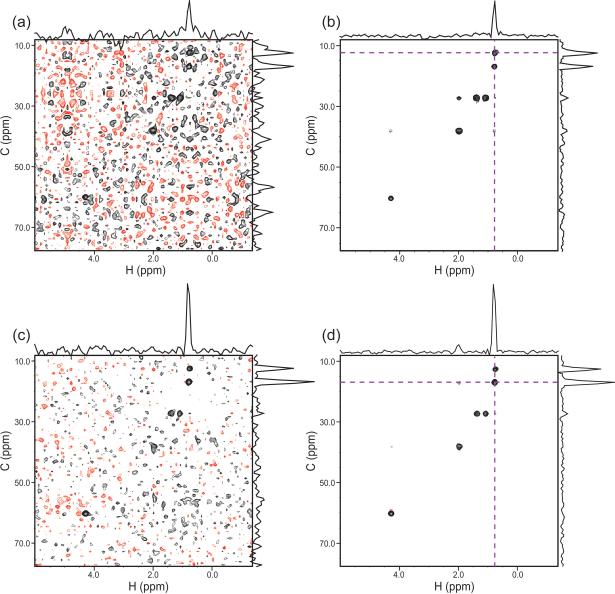
Figure 8. Comparison of Results with and without CLEAN.
(a) The plane from the 4-D HCCH-TOCSY at H = 0.73 ppm, C = 12.6 ppm (Ile6 Hδ1/Cδ1), for processing with the FT alone. (b) The same plane as in (a) after processing with CLEAN, plotted at the same contour level. The calculation was stopped automatically under the 5% noise stabilization criteria. (c) The plane at H=0.78 ppm, C = 16.9 ppm (Ile6 Hγ2/Cγ2), without CLEAN and (d) with CLEAN.

