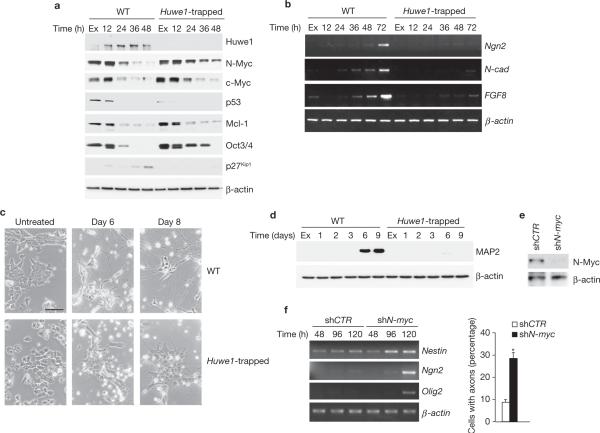
Figure 4.
Blockade of neuronal differentiation by genetic inactivation of Huwe1 is rescued by silencing of N-myc. (a) Wild-type and Huwe1-trapped ES cells were plated in differentiation medium and collected at the indicated times. Lysates were analysed by immunoblotting using the indicated antibodies. (b) Cells treated as in a were examined for gene expression by semi-quantitative RT–PCR. (c) Cells cultured for 4 days in differentiation medium were trypsinized and re-plated in the same medium on poly-d-lysine- and laminin-coated dishes. Bright-field images were taken 2 (day 6) and 4 (day 8) days after re-plating. Scale bar is 40 μm. (d) Cultures treated as in c were collected at the indicated times and analysed by immunoblotting using the neuronal marker MAP2. (e) Cells transduced with lentivirus expressing shRNA against N-myc or control lentivirus were analysed by western blotting using antibodies directed against N-Myc. β-actin is shown as a control for loading. (f) Cells treated as in e were plated in differentiation medium, collected at the indicated times and examined for gene expression by semi-quantitative RT–PCR (left panel). The number of cells showing axonal projections was scored. At least 1,500 cells were counted from 36 randomly chosen fields (right panel). Results are mean ± s.e.m. (*P = 4.7 × 10⁻⁸, Student's t-test, n = 3). Full scans of immunoblots are shown in Supplementary Information, Fig. S9.

