Figure 6.

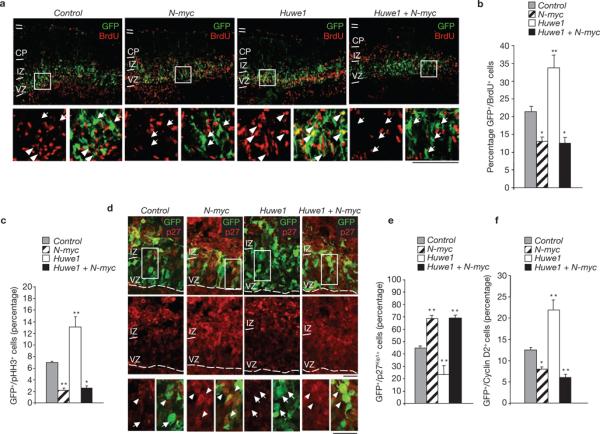
The Huwe1–N-Myc pathway in the developing brain. (a) Ex vivo electroporation of control, N-myc, Huwe1 and N-myc + Huwe1 siRNA into E13.5 mouse cortices followed by organotypic slice culture for 1.5 days. Cortical slices were double-labelled with BrdU (red) and GFP (green) to identify transfected cells. Scale bars are 100 μm. (b) Quantification of GFP-positive/BrdU-positive cells. (c) Quantification of GFP-positive/pHH3-positive cells. (d) Cortical slices were double-labelled with p27Kip1 (red) and GFP (green). Scale bars are 50 μm. (e) Quantification of GFP-positive/p27Kip1-positive cells. (f) Quantification of GFP-positive/Cyclin D2-positive cells. Results shown are mean ± s.e.m. of three sections from one experiment (*P < 0.05, **P < 0.01, Student's t-test). Arrowheads indicate GFP-positive/Cy3-positive cells; arrows indicate GFP-positive/Cy3-negative cells. IZ, intermediate zone; VZ, ventricular zone.
