Figure 3.
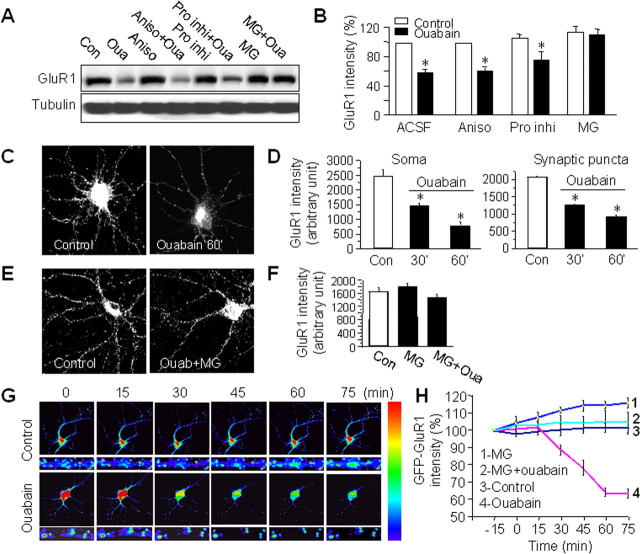
Ouabain reduces AMPAR abundance via proteasome-mediated proteolysis. A, B, Cortical neurons were first incubated with the protein synthesis inhibitor anisomycin (Aniso, 30 μm) for 1 h or a specific proteasome inhibitor MG-132 (MG, 10 μm), or mixed protease inhibitors (Pro inhi, 1:300) for 30 min, and then supplemented with ouabain (Oua, 50 μm) for 1 h. Compared with the control (Con), ouabain treatment significantly reduced GluR1 amount. Suppression of protein synthesis did not affect ouabain-induced GluR1 reduction, indicating the change in AMPAR amount was not caused by inhibition of AMPAR synthesis. In contrast, blockage of proteasome activity by MG-132 completely abolished the ouabain effect, whereas a mixture of protease inhibitors had no effect, indicating that the NKA-dependent decrease of AMPARs was caused by proteasome-mediated protein degradation (n = 4). *p < 0.05, t test. C, D, Cortical neurons were treated with ouabain for 30 min and 60 min and immunostained with antibodies against GluR1 under permeant conditions. Ouabain treatment reduced immunofluorescence intensity at both the soma (n = 12–23) and the dendritic puncta (n = 400–500 puncta). E, F, Application of MG-132 30 min before and during 1 h ouabain treatment largely blocked the ouabain effect on dendritic GluR1 immunointensity (n = 23), consistent with the notion of AMPAR degradation via proteasome. G, H, Live imaging of GluR1 degradation in transfected neurons. A coverslip of neurons transfected with GFP-GluR1 was transferred to a chamber in ACSF under a fluorescence microscope and imaged every 15 min. Control neurons showed stable GFP fluorescence in 1.5 h. After addition of ouabain in the bath at time 0, GFP-GluR1 fluorescence intensity dropped to 60% of the control before stabilization at low levels. However, in the presence of the proteasome inhibitor MG-132 (10 μm), no changes in fluorescence intensity were observed during ouabain treatment. Images were representative neurons imaged under control and ouabain conditions, part of which was enlarged for clarity (G). The rainbow bar on the right indicates the relative intensity of the fluorescence signal. Quantitative data were from measurements of the soma (n = 7 for each experiment) (H). Bar graph data present means ± SEM, *p < 0.05, t test.

