
Figure 2.
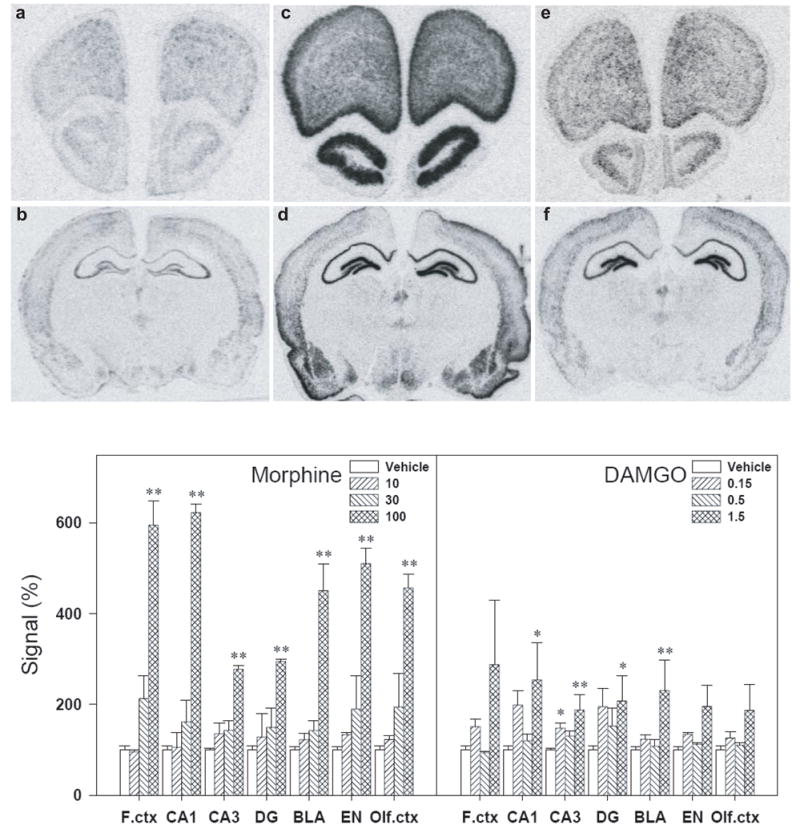
Representative autoradiograms of BDNF mRNA expression in the rat brain regions (a–f, top panels). BDNF mRNA expression was determined 3 h after i.c.v. administration of drugs. (a&b) Sections taken from a vehicle-treated animal. (c&d) Sections taken from an animal treated with morphine (100 μg, i.c.v.). (e&f) Sections taken from an animal treated with DAMGO (1.5 μg, i.c.v.). Quantification of BDNF mRNA signals in different brain regions are represented as mean percent of vehicle ± S.E.M. (bottom panels). *, P<0.05 and **, P<0.01 compared with vehicle. See Materials and Methods for other details.