
Fig. 11.
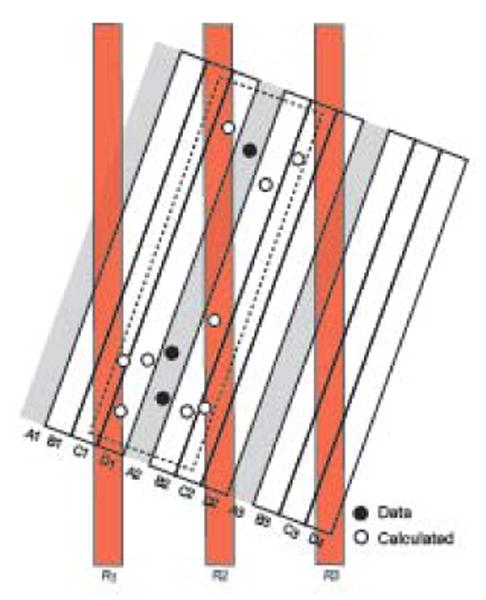
Filling data gaps in 3D space and data resampling model. The block of slices (A1-D4) represents 12 serial histological sections divided into three consecutive 1-in-4 series, with series A stained for tissue component x (filled circles). For simplicity, x is sparse, and only three discrete instances were observed, all in section A2 (none in A1 and A3). To generate a more realistic view of what actually occurs in the tissue, a statistical model of the data could be calculated for the adjacent sections that were not stained for x (open circles in the dashed rectangle). If this is done, the data model can be resliced in any direction (calculated slices R1-3) and a statistically meaningful pattern observed. If “empty” space is not populated with estimated data, reslicing as indicated yields a degraded data pattern proportional to the proportion of empty space. The resliced plane of section could be that of a reference atlas (for example, Fig. 2B). For geometrical accuracy and simplicity the model has been constructed at the section thickness set on the microtome, not at the time of section photography.