
Fig. 12.
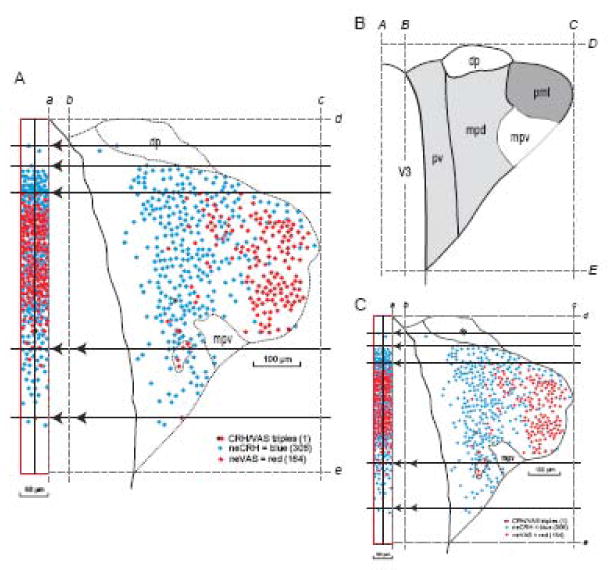
Compression of PVH data mapped in the transverse plane into a slice of a sagittal projection map for spatial distribution overview (A) and linear scaling of the data to a reference Atlas Level (B, C). A. Data from a 15 μm-thick transverse section of the PVH is moved horizontally (dashed lines with arrowheads) into a vertical bin on the left, scaled to be 60 μm wide in a sagittal projection map of the PVH (Fig. 2), using principles illustrated in Figure 11 and implemented manually here. Mapped in this histological section were retrogradely labeled neurons that immunostained for CRH (neuroendocrine CRH neurons, neCRH; blue), retrogradely labeled neurons that immunostained for VAS (neuroendocrine VAS neurons, neVAS; red), and one neuron that appeared to be triply labeled (numbers in parentheses are total number of indicated neuron types with a visible nucleus in the section). Margin of the third ventricle is black and dotted lines indicate subdivisions of the PVH determined from nearby Nissl-stained sections. From brain PVH12C, 4/3 (CRH & VAS double immunostaining with fast blue retrograde labeling). Dorsal (top), ventral (bottom), medial (left), and lateral (right) bounding lines were interpolated between Nissl-stained sections 12A 4/3 and 12A 4/4 position lines on the sagittal projection. Also see Fig. 10A for CRH immunostaining plotted a different way for this section. B, C. Parts A and B are to scale, so a first step in fitting the data from a histological section (A) to a corresponding reference Atlas Level (B) is to perform linear scaling in the horizontal and vertical axes. The approach to accomplish this here for the PVH was to establish in each section its medial border (b, B), lateral border (c, C), dorsal border (d, D), and ventral border (e, E), all in relation to the vertical midline of the brain (a, A). The scaled histological section (C) is then produced with the Scale Tool of a graphics program, using horizontal and vertical percentages calculated from the ratios BC/bc and DE/de, respectively. The next step would involve the grid transfer method described in Figures 6-8, unless the reference atlas and experimental brain were cut in the identical plane of section, in which unlikely case nonlinear warping of C onto B could be performed.