
Fig. 13.
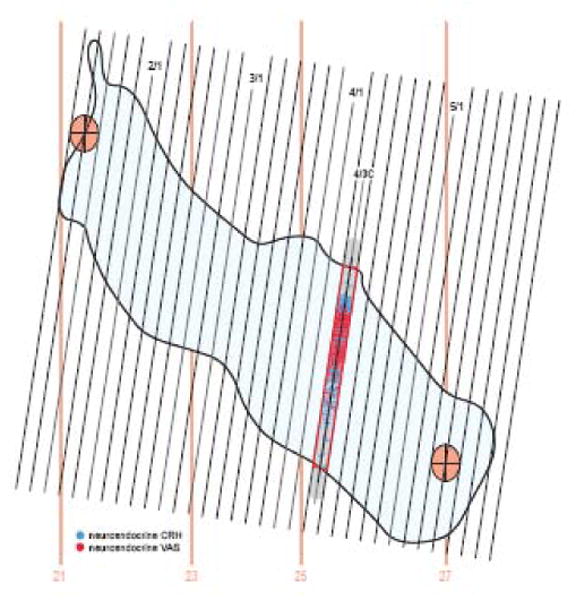
Data for one bin of the PVH sagittal projection summary map. The data for CRH and VAS neuroendocrine neurons on a transverse section is replotted on this schematic sagittal projection of the PVH outline, taking the 60 μm-thick “slice” or bin generated in Figure 12 (gray outlined area at 4/3). The section was from brain PVH12, 1-in-4 series C, slide 4/section3 (for relative location, see Fig. 4E, F). By reiterating this process for each 1-in-4 section of the series, the entire sagittal flatmap is populated, yielding one view of a comparison of distribution patterns for these two cell types. In this way an accurate representation of data distribution in the sagittal plane throughout the rostrocaudal extent of the PVH can be shown, with no information about mediolateral data distribution. The same procedure can be done for the PVH dorsal projection where medial to lateral data distribution is preserved throughout the rostrocaudal extent of the PVH (Figs. 4-6).