
Fig. 14.
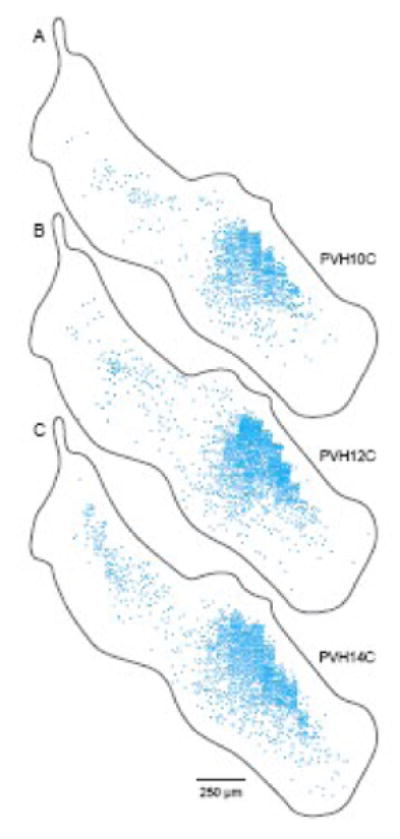
Distribution of neuroendocrine CRH neurons (blue dots) in three different animals viewed on sagittal PVH projection maps (A-C). Data from one 1-in-4 series of 15 μm-thick frozen sections in each animal were transferred as shown in Figures 12 and 13 onto a sagittal projection map of the rat PVH. The staircase effect in the region of greatest neuron density (centered around the transverse level illustrated in Fig. 10) is due to three factors (see Fig. 9): high neuron density, great curvature of the bounding region (PVHmpd), and use of an interrupted data set (here a 45 μm gap between 15 μm-thick sections). Series PVH10C was stained with the sheep antiCRH antiserum, whereas series PVH12C and PVH14C were stained with the rabbit antiCRH antiserum.