
Fig. 2.
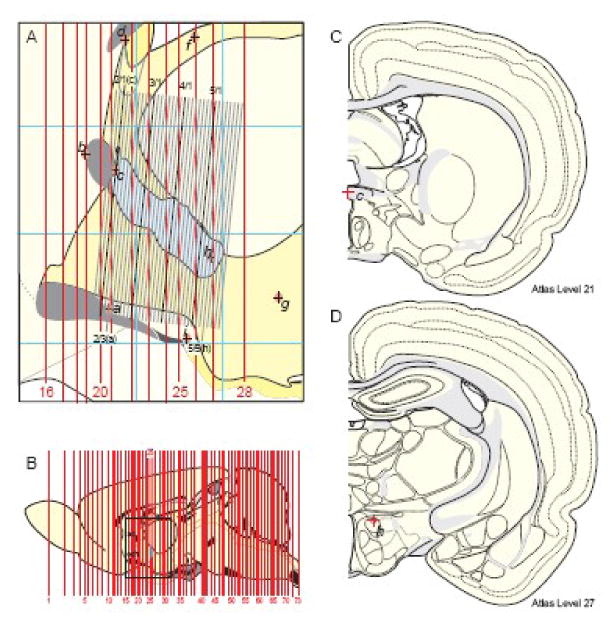
Graphical comparison of brain section levels represented in a reference atlas with a serial set of tissue sections from an experimental brain. A. This is a midsagittal view of the rat forebrain region surrounding the PVH (blue outline of its border), indicated by the rectangle in (B), which is a midsagittal view of the rat brain along with a thick red line indicating the position of Atlas Level 25. In A, Atlas levels 16-28 are indicated with vertical red lines (whose thickness is to scale, for these 40 μm-thick celloidin sections), whereas a 1-in-4 series of 15 μm-thick frozen transverse sections from another (experimental) brain cut at a different plane of section is shown to scale as the tilted array of black/gray lines. Each black/gray line indicates a section and space between black/gray lines indicates the presence of three sections belonging to the other three1-in-4 series; that is, each line and space indicates a block of 4 serial 15 μm-thick frozen sections (60 μm total). Every 6th line is black indicating that blocks of 6 successive 1-in-4 sections (one black and 5 gray) were mounted on each 1×3 inch microscope slide (notation at top: series of 6 1-in-4 series/number of series). Light red ovals with internal cross indicate the position of fiducial marks: a, rostral end of the suprachiasmatic nucleus; b, rostral edge of the anterior commissure; c, caudal edge of the suprachiasmatic nucleus; d, rostral edge of the subfornical organ; f, rostral tip of the medial habenula; g, posterior part of the dorsomedial nucleus of the hypothalamus; h, dorsal part of the anterior hypothalamic nucleus; i, rostral end of the arcuate nucleus. The orientation of the experimental series relative to the atlas orientation was determined geometrically. The sections with two more or less vertical fiducials (a and c; 2/3 and 2/1, respectively) was determined and then lined up on the atlas projection simply by rotating and aligning the block of experimental sections. Then the number of experimental sections between atlas fiducials a and h was determined, and a linear correction factor was calculated to fit the experimental series between atlas fiducials a and h. Thin blue horizontal and vertical lines indicate stereotaxic coordinates 1 mm apart. B. This is a sagittal outline of the reference Atlas brain that was scaled to the dimensions of the frozen sections for convenience of computer graphics manipulations as described in the text. Abbreviations: ac, anterior commissure; och, optic chiasm. C and D. Drawings of transverse Atlas Levels 21 and 27, whose rostrocaudal position is shown in parts A and B. They are shown to illustrate the position of fiducial marks c and h (labeling the red crosses in C and D, respectively) from part A. All parts adapted from Swanson (1998).