
Fig. 6.
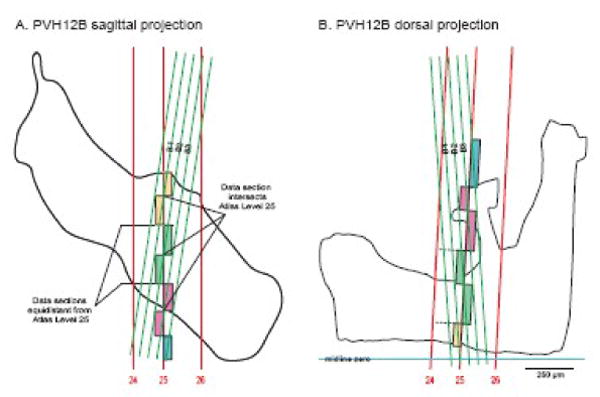
Segmenting regions of experimental sections for data transfer to a reference Atlas Level. For illustration brain PVH12 was used because its plane of section is clearly different than that of the reference Atlas (see Fig. 4). In both the sagittal and dorsal projections, three Atlas Levels (24-26) are shown, along with the relative position of a 1-in-4 series of 15 μm-thick histological sections (series B), three of which contain data that should be transferred to Atlas Level 25, based on principles illustrated in Figure 3. Transition from one experimental section to another (e.g., from B1 to B2) on the target Atlas Level (25) is determined by the point where the line representing each experimental section is equidistant from the Atlas Level. Experimental sections are coded by individually colored boxes that span the area to be mapped onto the atlas template (see Fig. 7). Note that in this example experimental sections are separated by a gap of 45 μm (because every fourth 15 μm-thick section was stained with a particular pair of primary antisera). Sections B1-3 correspond to series B in 4/2-4/4 in Figure 2.