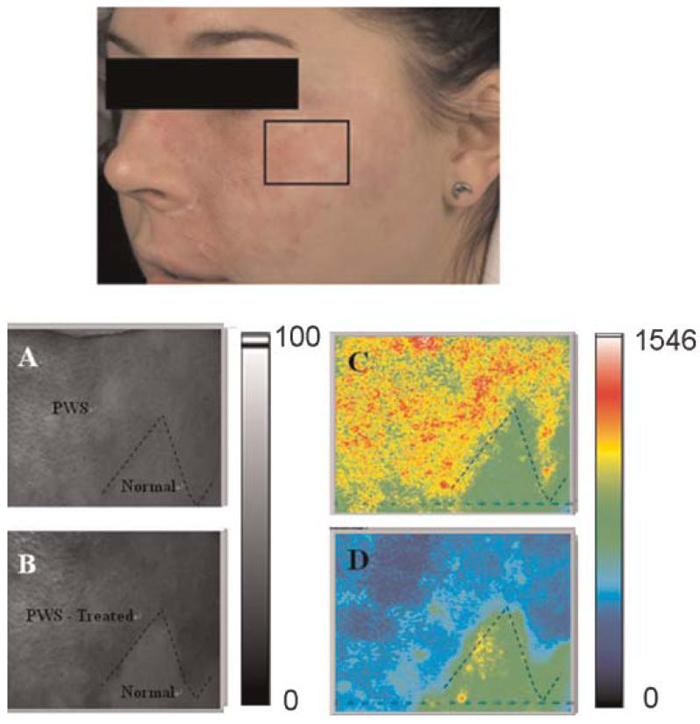
Fig. 8.
Region of interest selected for LSI. The region was selected to include both PWS and normal skin. SFI maps (C,D) of a selected skin area treated with a pulsed dye laser. Parts (A,B) are gray scale images. Images were acquired (A,C) immediately before and (B,D) 15 minutes after treatment. The black dashed line represents the border between PWS and normal skin. [Figure can be viewed in color online via www.interscience.wiley.com.]

