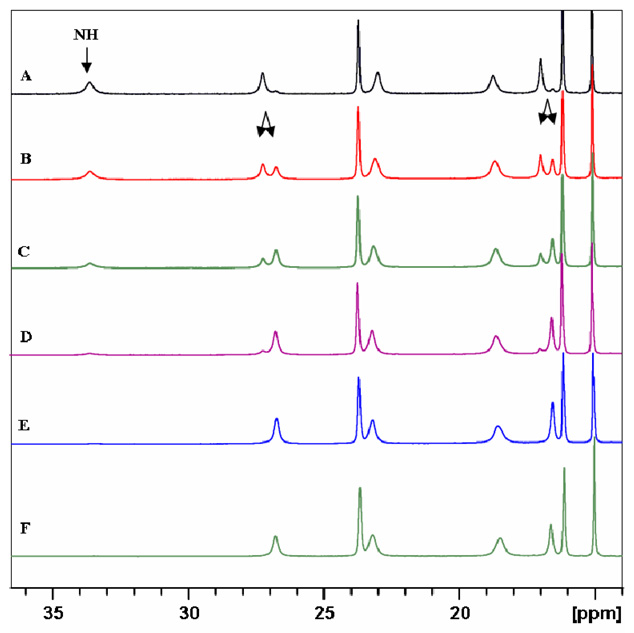
Fig. 9.
The fragments of the 1H NMR spectra (298K, CD3OD) of (P)-[YbLRRRRRR](NO3)3•6H2O complex, illustrating the disappearing of NH signal, doubling of the resonances due to isotope effect and the influence of added base. Traces A – E : spectra measured after 0.45 h, 1.45 h, 2.45 h, 4.45h, and 27h, respectively; trace F: spectrum of a sample containing 5 µL of N(C2H5)3 measured after 0.25 h.

