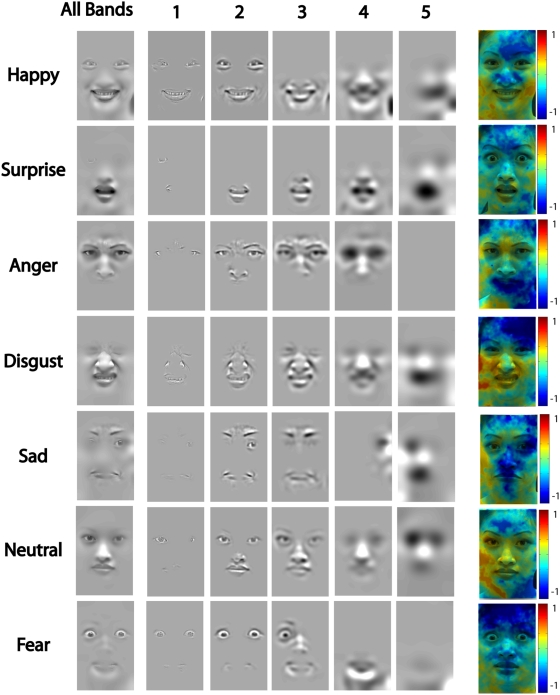
Figure 2. Meta-Analysis of the Behavioral Data.
For each spatial frequency band (1 to 5), a classification image reveals the significant (p<.001, corrected, [51]) behavioural information required for 75% correct categorization of each of the seven expressions. All bands. For each expression, a classification image represents the sum of the five classification images derived for each of the five spatial frequency bands. Colored Figures. The colored figures represent the ratio of the human performance over the model performance. For each of the five spatial frequency bands, we computed the logarithm of the ratio of the human classification image divided by the model classification image. We then summed these ratios over the five spatial frequency bands and normalized (across all expressions) the resulting logarithms between −1 and 1. Green corresponds to values close to 0, indicating optimal use of information and optimal adaptation to image statistics. Dark blue corresponds to negative values, which indicate suboptimal use of information by humans (e.g. low use of the forehead in “fear”). Yellow to red regions correspond to positive values, indicating a human bias to use more information from this region of the face than the model observer (e.g. strong use of the corners of the mouth in “happy”).

