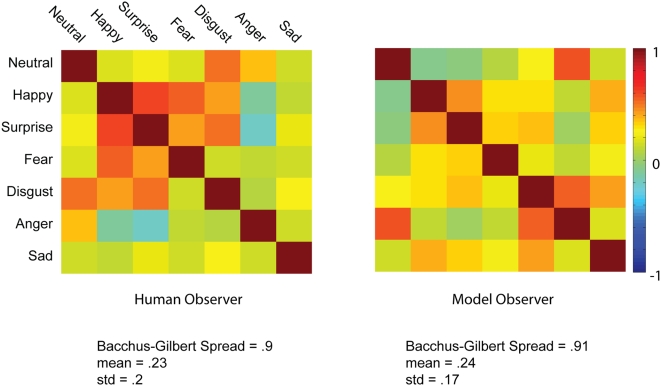
Figure 3. Meta-Analysis of the Behavioral Data: Cross-Correlations of the Classification Images.
For both the human and the model observers, we transformed the 380×240 pixels×5 spatial frequency bands classification images into a one-dimensional 38×24×5 vector. We Pearson-correlated these vectors to produce the correlation matrices shown in the figure, with correlation values ranging between 1 (in dark red) and −1 (in dark blue). Backus-Gilbert Spread of the correlation matrix is reported together with mean correlation and standard deviation.

