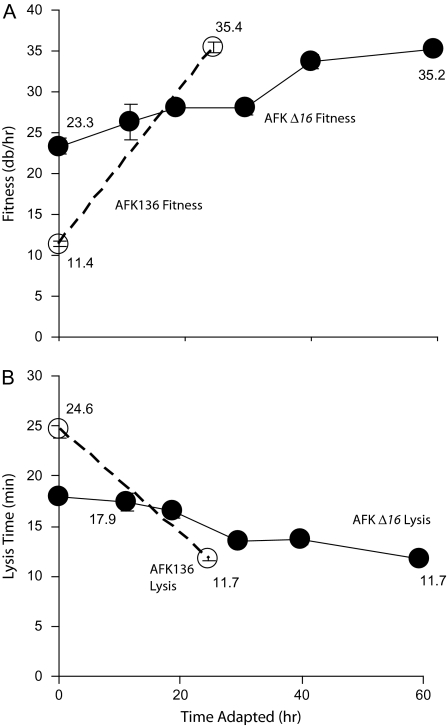
FIG. 1.—
Evolution of AFK Δ16 (solid lines) on +gp16 hosts. (A) Fitness and (B) time to lysis. Data for AFK136 (dotted lines, open symbols) are from Heineman et al. (2005). Numbers are presented for the start and end of adaptation. Error bars, sometimes smaller than the data point, indicate ±one standard error.

