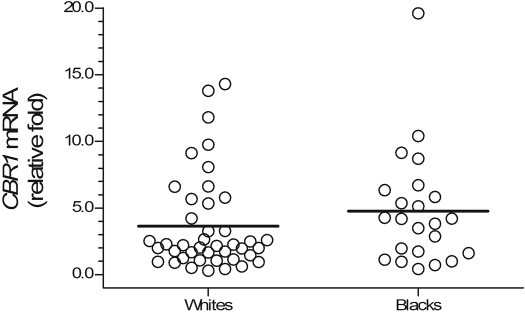
Fig. 2.
Hepatic CBR1 mRNA expression in samples from white (n = 42) and black (n = 23) donors. Relative CBR1 mRNA levels were determined with the comparative quantitation method (see text for details). Individual β-actin mRNA levels were used as normalizers. Samples and standards for calibration curves (r2 > 0.94) were analyzed in quadruplicates. Each circle depicts the average of individual samples. Horizontal lines indicate group means (p = 0.217).

