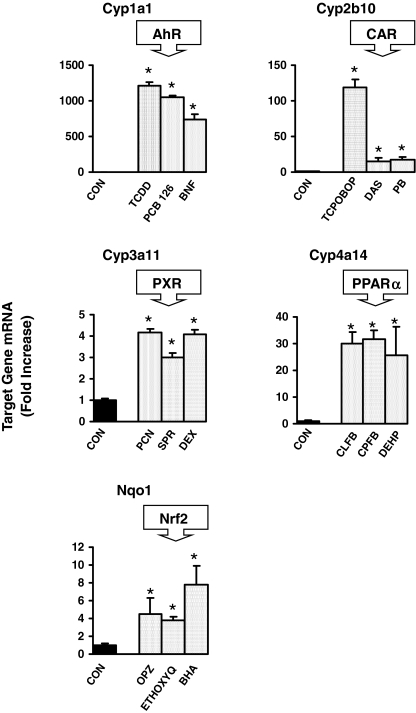
Fig. 1.
Messenger RNA expression of Cyp1a1, Cyp2b10, Cyp3a11, Cyp4a14, and Nqo1 by the bDNA assay in male mouse livers treated with activators of AhR, CAR, PXR, PPARα, and Nrf2, respectively (n = 5/treatment). Data are expressed as -fold induction compared with vehicle controls. Values are expressed as mean ± S.E.M. Asterisks (*) indicate statistically significant differences between control and treatment groups (p ≤ 0.05).

