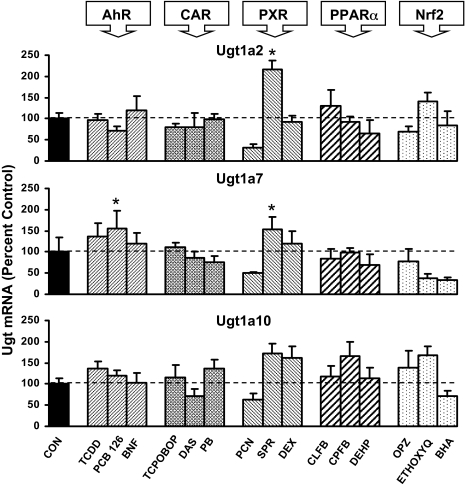
Fig. 3.
Messenger RNA expression of Ugt1a2, Ugt1a7, and Ugt1a10 in livers of male mice treated with three activators of AhR, CAR, PXR, PPARα, and Nrf2 (n = 5/gender) by the bDNA assay. Data are expressed as percentage control. Values are expressed as mean ± S.E.M. Asterisks (*) indicate statistically significant differences between control and treatment groups (p ≤ 0.05).

