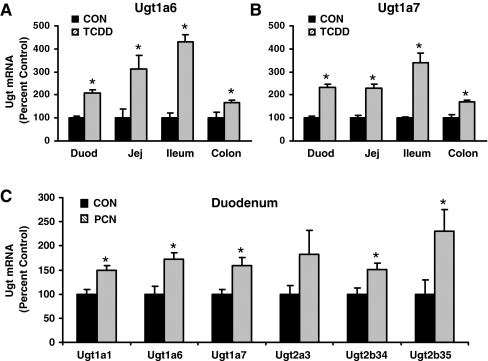
Fig. 7.
A, mRNA expression of Ugt1a6 in duodenum, jejunum, ileum, and colon treated by corn oil or TCDD by the bDNA assay (n = 5/treatment). B, mRNA expression of Ugt1a7 in duodenum, jejunum, ileum, and colon treated by corn oil or TCDD by the bDNA assay (n = 5/treatment). C, mRNA expression of Ugt1a1, Ugt1a6, Ugt1a7, Ugt2a3, Ugt2b34, and Ugt2b35 in duodenum of mice treated with corn oil or PCN. For parts A, B, and C, data are expressed as percentage. Values are expressed as mean ± S.E.M. Asterisks (*) indicate statistically significant differences between control and treatment groups (p ≤ 0.05).

