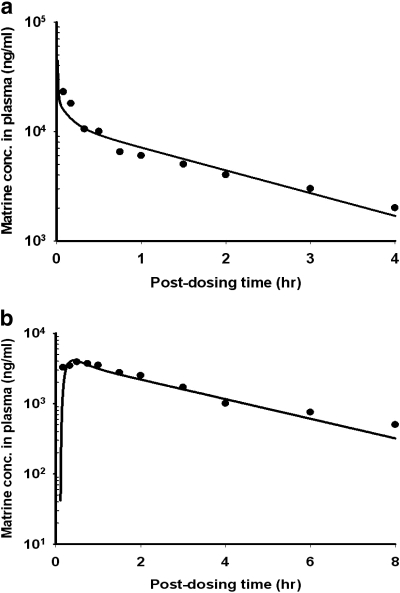
Fig. 4.
Time course of matrine plasma concentrations in rats receive: a, bolus intravenous injection of 40 mg/kg pure matrine; or b, single oral dose of 40 mg/kg pure matrine. Solid line, model simulation. Data points, mean of experimental data. They were read digitally from the publication of Wu et al. (2003).

