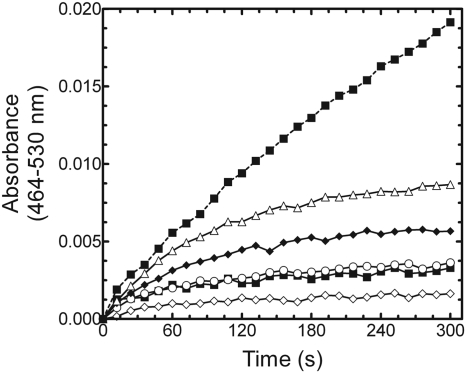
Fig. 6.
Effect of H2O2 on HO-1 activity. H2O2 was added to a series of HO-1 reactions containing 2:1 CPR/HO-1 in the absence of catalase. H2O2 concentrations included 0 μM (▵), 5 μM (♦), 15 μM (○), 30 μM (▪), and 60 μM (⋄). Bilirubin formation in the presence of catalase and no exogenous H2O2 was included for comparison (dashed line). Each point represents the average of three determinations.

