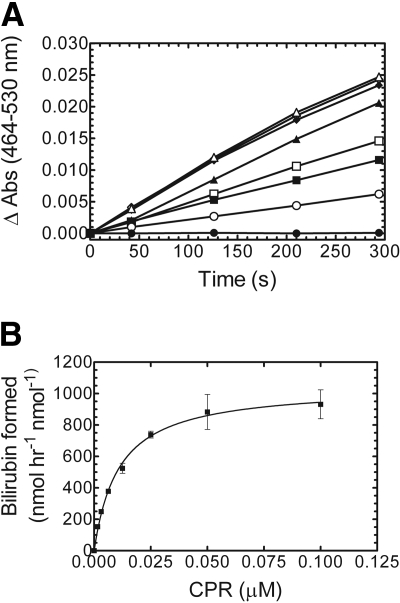
Fig. 9.
Effect of CPR concentration on HO-1 activity. A, time course for bilirubin formation. CPR concentrations included 0 μM (•), 0.0015 μM (○), 0.003 μM (▪), 0.00625 μM (□), 0.0125 μM (▴), 0.025 μM μM (▵), 0.05 μM (♦), and 0.1 μM (⋄). B, the rate of bilirubin formation as a function of CPR concentration. All the assays contained 0.05 μM HO-1. Values in B represent the mean ± S.E. of n = 3.

