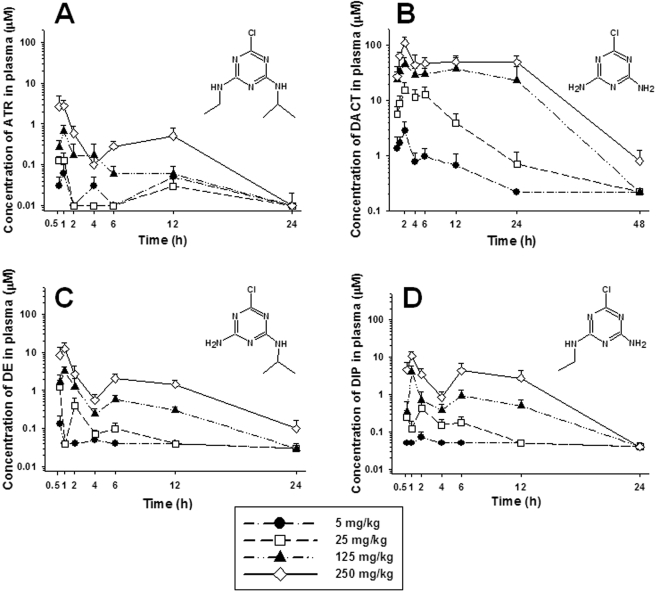
Fig. 2.
Concentration of ATR and its metabolites in mouse plasma determined by LC/MS at the indicated time points after single ATR treatments at four different dose levels. A, concentration of ATR. B, concentration of DACT. C, concentration of DE. D, concentration of DIP. Each time point represents the mean ± S.E.M.; n = 5, 8, 8, 8, 6, 6, and 8 mice/dose for plasma samples collected at 0.5, 1, 2, 4, 6, 12, and 24 h, respectively.

