
FIGURE 3. Externalization of phosphatidylserine, loss of mitochondrial membrane potential, caspase activity, and PARP cleavage but not DNA degradation occurs in FasL- or UV-treated Jurkat cells in the presence of CB.
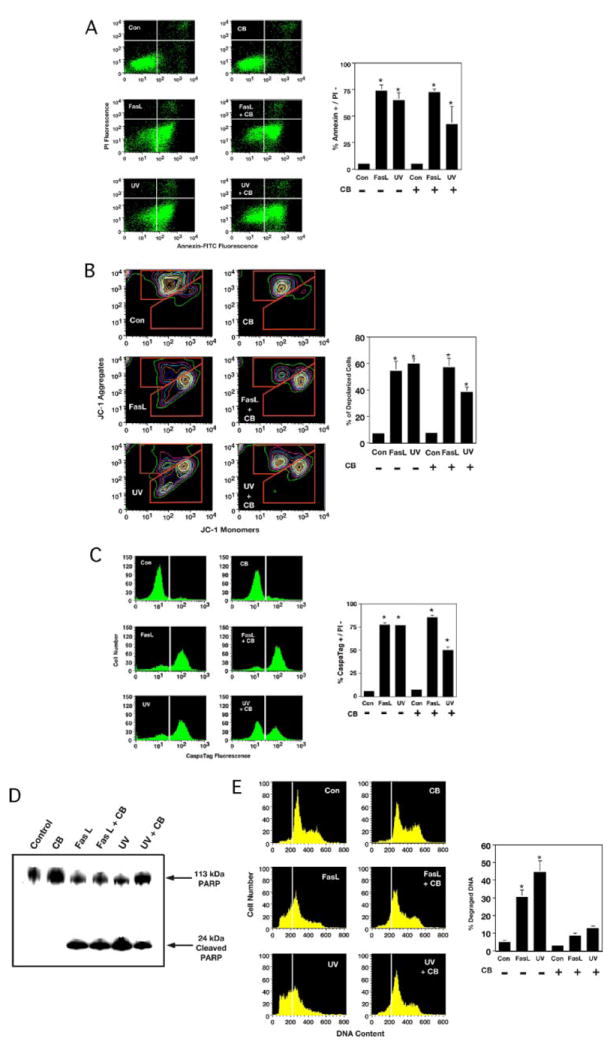
Jurkat cells treated with 50 ng/ml Fas ligand or 60 mJ/cm2 UV in the presence or absence of 5 μm CB for 4 h were examined for various apoptotic characteristics. A, externalization of phosphatidylserine using annexin-V-fluorescein isothiocyanate and flow cytometry. An increase in the number of cells that had an increased annexin-V-fluorescein isothiocyanate fluorescence before the loss of membrane integrity (lower right-hand quadrant) occurred independent of CB. The dot plots represent a single experiment, and percents on the graph are the average from three independent experiments. B, changes in the mitochondrial membrane potential were examined by flow cytometry using JC-1. Cells that have a depolarized mitochondrial membrane have an increased monomeric fluorescence while having a simultaneous decreased aggregate fluorescence. FasL- or UV-treated Jurkat cell in the presence of CB showed a similar loss of mitochondrial membrane potential compared with analogous samples in the absence of CB. The contour plots represent a single experiment, and the percents on the graph are the average number of depolarized cells from three independent experiments. C, caspase-3-like activity measured using a fluorescent caspase substrate. An increase in the number of cells that are caspase-positive occurred independent of CD. The histograms represent a single experiment, and percents on the graph are the average of three independent experiments. D, Western blot analysis for PARP cleavage. Protein extracts from FasL- or UV-treated Jurkat cells in the presence or absence of CB showed a similar cleavage of PARP resulting in the occurrence of a 24-kDa protein band. E, examination of DNA content by flow cytometry. The occurrence of degraded DNA is shown below the G1 DNA peak (white line). The histograms represent a single experiment, and the percents on the graph are the average number of cells with subdiploid DNA from three independent experiments (*, p < 0.001).