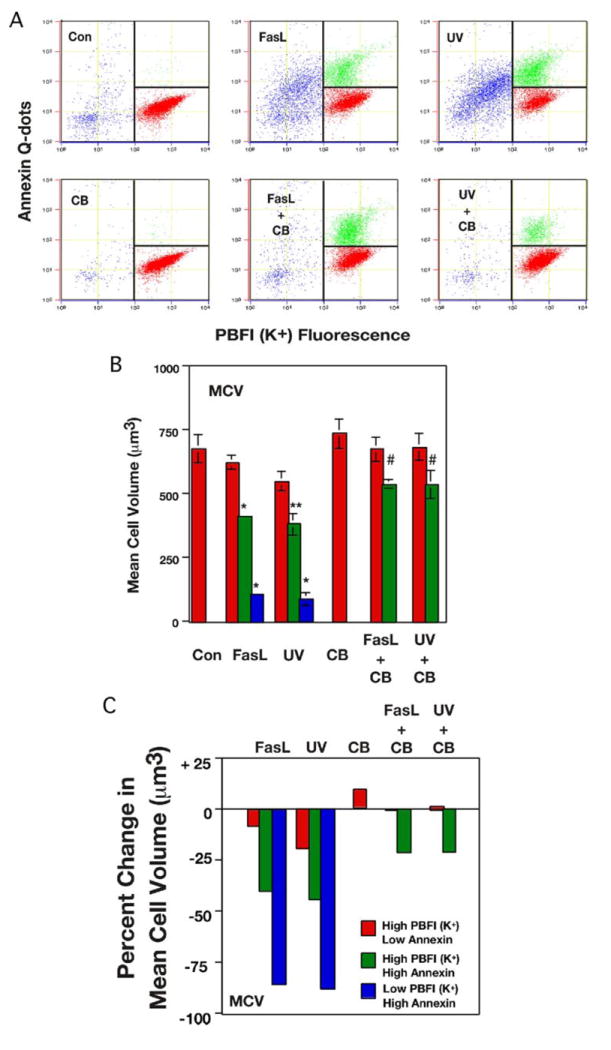
FIGURE 5. Determination of mean cell volume and percentage of change in mean cell volume by the simultaneous examination of intracellular potassium and externalization of phosphatidylserine in apoptotic-stimulated Jurkat cells in the presence and absence of CB.

A, Jurkat cells treated with 25 ng/ml Fas ligand or 30 mJ/cm2 UV in the presence or absence of 5 μm CB for 4 h were examined for changes in intracellular potassium using PBFI-AM and externalization of phosphatidylserine using biotinylated annexin-V and streptavidin Q dots by NPE cell analysis. In the absence of CB, three distinct populations of cells are observed corresponding to the normal cells (red), the primary stage of AVD (green), and the secondary stage of AVD (blue). In the presence of CB, only the normal (red) and primary stage of AVD (green) cells were observed. The dot plots represent a single experiment of three independent experiments. B, distinct populations of cells were analyzed for changes in their MCV (μm3) using a calibrated scale for the electronic cell size. For each experimental condition, the high potassium/low annexin population is shown in red, the high potassium/high annexin populations is shown in green, and the population of cells with a major loss of intracellular potassium is shown in blue. A clear decrease in MCV was observed based on both the externalization of the phosphatidylserine and the loss of intracellular potassium for each population of cells. The bars represent the average number of three independent experiments (*, p < 0.001; **, p < 0.01; #, p < 0.05). C, percentage of change in MCV for the various stages of AVD in the presence and absence of CB. The control untreated Jurkat cells were used as the standard to which all other populations of cells were compared.
