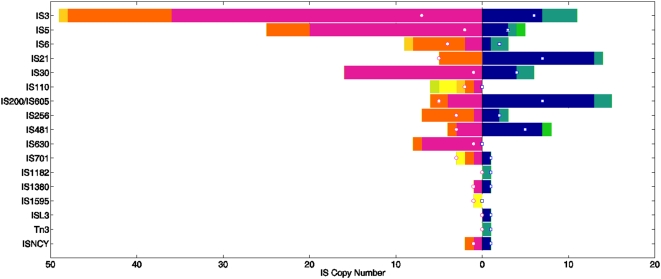
Figure 5. IS family distribution of intact ISs in M. extorquens AM1 and DM4.
The bar length shows the total intact IS copy number of each IS family in DM4 (right) and AM1 (left) (see Suppl. Table S4). Differently colored regions represent different replicons : blue – DM4 chromosome, cyan – DM4 plasmid p1METDI, green – DM4 plasmid p2METDI, pink – AM1 chromosome, orange – AM1 megaplasmid, dark yellow – AM1 plasmid p1META1, light yellow – AM1 plasmid p2META1, light green – AM1 plasmid p3META1. Open circles and squares represent the numbers of different types of ISs within each family in AM1 and DM4, respectively.

