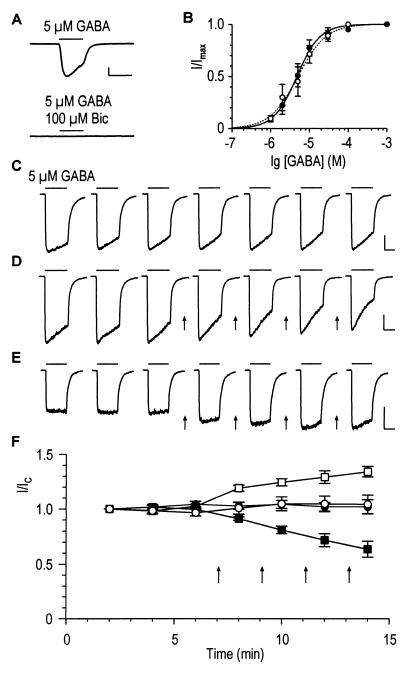
Figure 1.
Dopamine-mediated reduction and enhancement of GABA-induced membrane currents in granule cells and M/T cells of rat olfactory bulb (respectively). Horizontal and vertical scales correspond to 5 s and 500 pA, respectively. (A) GABA-induced whole-cell currents were completely blocked by 100 μM bicuculline (Bic). (B) Dose-response curves of GABA-induced peak currents of granule cells (filled symbols) and M/T cells (open symbols). The EC50 was 4.7 ± 1.7 μM and the Hill coefficient was n = 1.5 ± 0.1 for granule cells (n = 6, solid line). For M/T cells, the values obtained from the fit are EC50 = 5.1 ± 2.2 μM and n = 1.2 ± 0.1 (n = 5, dashed line). (C–E) Time dependence of GABA-induced membrane currents. (C) Stability of control peak-currents during 14 min of recording illustrated for a granule cell. A moderate acceleration of the speed of desensitization was observed in this and in most other cells. (D) Decrease of control GABA responses in a granule cell after repeated dopamine application (50 μM, 30s, arrows). (E) Increase of GABA-induced currents in a M/T cell. (F) Time-dependent changes of normalized GABA responses in control cells (23 granule cells, ●; 6 M/T cells, ○) and dopamine experiments (6 granule cells, ■; 4 M/T cells, □).

