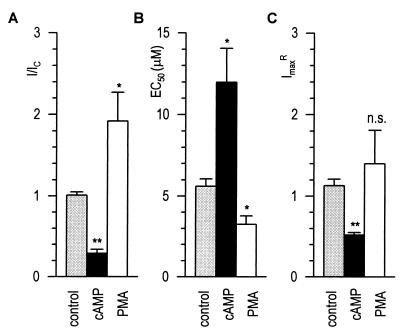
Figure 4.
Effects of PKA and PKC on the activation properties of GABAA receptors. I/IC (A), EC50 (B), and ImaxR (C) determined after 14 min of whole-cell recording (see Materials and Methods). Average data are plotted for control (shaded bars, n = 21), granule (100 μM cAMP, filled bars, n = 11), and M/T cells (100 nM PMA, open bars, n = 4). ∗∗, P ≤ 0.01; ∗, P ≤ 0.05.

