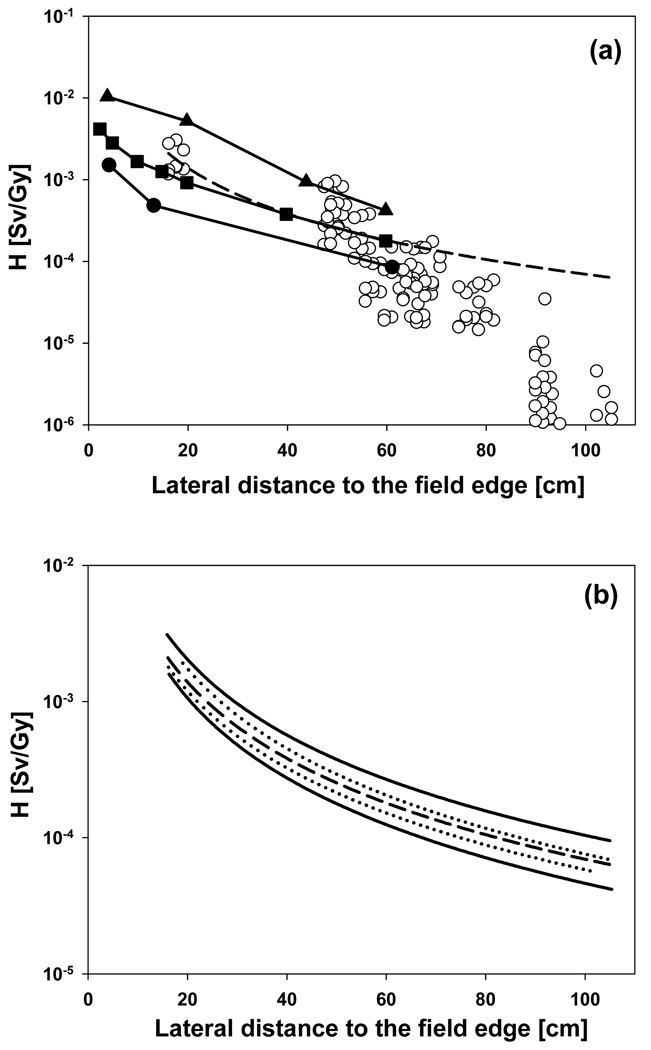
Figure 12.
(a, upper figure): Organ equivalent doses for the adult phantom for all 8 fields (open circles). The dashed line is a power law fit (366.2×distance−1.861). The distance in cm refers to the distance between the edge of the field and the approximate mean position of the organ. The solid lines show doses as a function of distance from the field edge measured at different proton facilities at different beam configurations (closed squares (Wroe et al 2007); closed circles (Mesoloras et al 2006)). The closed triangles show the scattered photon dose to be expected from IMRT treatment using a 10cm × 10cm field (Klein et al 2006). The solid lines were drawn to connect the data points. (b, lower figure): The dashed line is the same as in (a). The two dotted lines represent a fit of the data from the two small aperture fields (fields 1 and 4; upper curve) and of the data from the three large aperture fields (fields 3, 6 and 7; lower curve). The two solid lines represent a fit of the data from the three large treatment volumes (fields 1, 2 and 3; upper curve) and of the data from the three small treatment volumes (fields 4, 5 and 6; lower curve).

