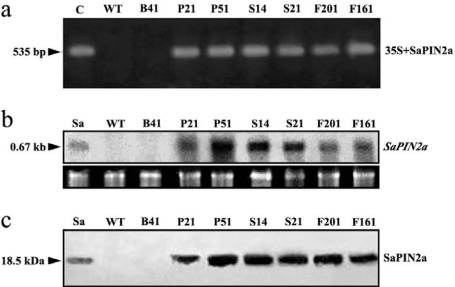
Figure 2.
Molecular characterization of transgenic tobacco plants.
(a) PCR analysis. Genomic DNA extracted from transgenic and control plants was used as template for PCR amplification with primers specific for 35S CaMV promoter and SaPIN2a cDNA. Amplified bands were indicated by an arrowhead. (b) Northern blot analysis. Total RNA (20 μg) isolated from transgenic and control plants. The blot was probed with random-primed 32P-labelled SaPIN2a cDNA. The hybridization bands corresponding to the SaPIN2a transcript (0.67 kb) are indicated by an arrowhead. Lower panel shows rRNA bands as loading controls. (c) Western blot analysis. Total proteins (50 μg) from transgenic and control plants using SaPIN2a-specific antibodies. Purified SaPIN2a (Sa, 0.4 μg) from S. americanum stems was used as a positive control. Cross-reacting bands (18.5 kDa) are indicated by an arrowhead. C, plasmid pARTSaf (positive control); Sa, total RNA (b) or purified SaPIN2a (c) from stems of S. americanum plants (positive control); WT, wild-type tobacco plants (negative control); B41, transgenic plant line transformed with pBI121 vector only (negative control); P21 and P51, transgenic plant lines transformed with pARTSaf; S14 and S21, transgenic plant lines transformed with pSa7; F201 and F161, transgenic plant lines transformed with pF121.

