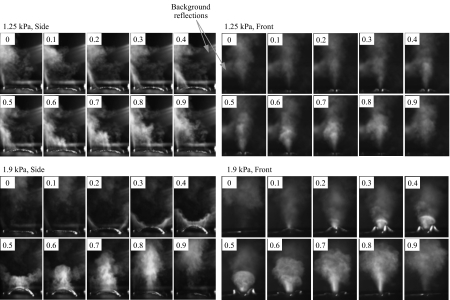
Figure 7.
Side view (left columns) and front view (right columns) of high-speed flow visualization at p=1.25 kPa (top) and p=1.9 kPa (bottom). The phase proceeds from left to right and from top to bottom for each image. Note that the side and front views were not obtained simultaneously, so that the phases shown (relative to one cycle) are only approximate.

