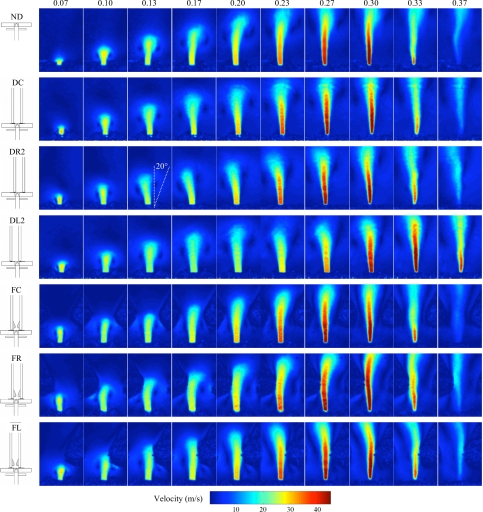
Figure 8.
(Color online) Ensemble-averaged velocity over the glottal cycle at pressure p=1.25 kPa. The icons outside of each image set show the respective test geometry show the respective test geometry and are defined in Fig. 3. The top row of text denotes approximate phase (referenced to fraction of one period).

