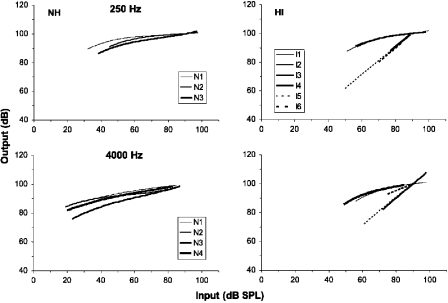
Figure 5.
Response functions derived from the results of phase 2 using the model described in the text. The left panels show the functions for the normal-hearing listeners (NH) and the right panels show the results for the hearing-impaired listeners (HI). The upper panels show the functions for the 250 Hz conditions and the lower panels show the functions for the 4000 Hz conditions.

