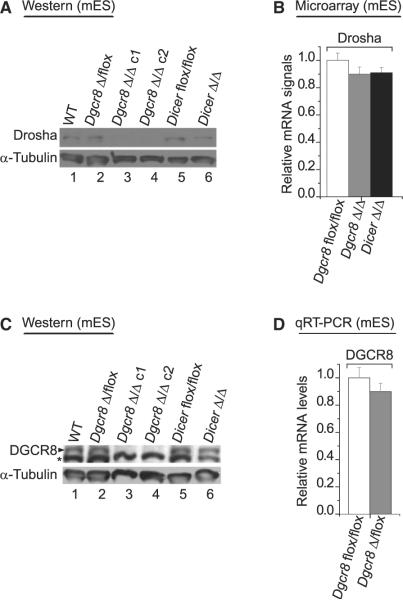
Figure 6. Expression of Drosha and DGCR8 in Dgcr8 KO Mouse ES Cells.
(A) Western blot analysis of Drosha in mouse ES cells. Δ/flox indicates heterozygote cells, and Δ/Δ indicates homozygous null cells. Two different KO lines (c1 and c2) were used for the experiments (lanes 3 and 4). The Dicer KO ES line (dicer Δ/Δ) was used as a control (Babiarz et al., 2008).
(B) Quantitation of the Drosha mRNA by Affymetrix chip analysis. Three independent experiments were performed (mean ±SD). The methods are described in Wang et al. (2008b).
(C) Western blot analysis of DGCR8 in mouse ES cells. The asterisk represents a nonspecific band which serves as a loading control.
(D) Quantitative real time PCR (qRT-PCR) of the DGCR8 mRNA in Dgcr8 KO mES cell. The relative DGCR8 mRNA levels were determined in wild-type (flox/flox) and heterozygote (Δ/flox). Three independent experiments were performed for quantification (mean ±SD).

