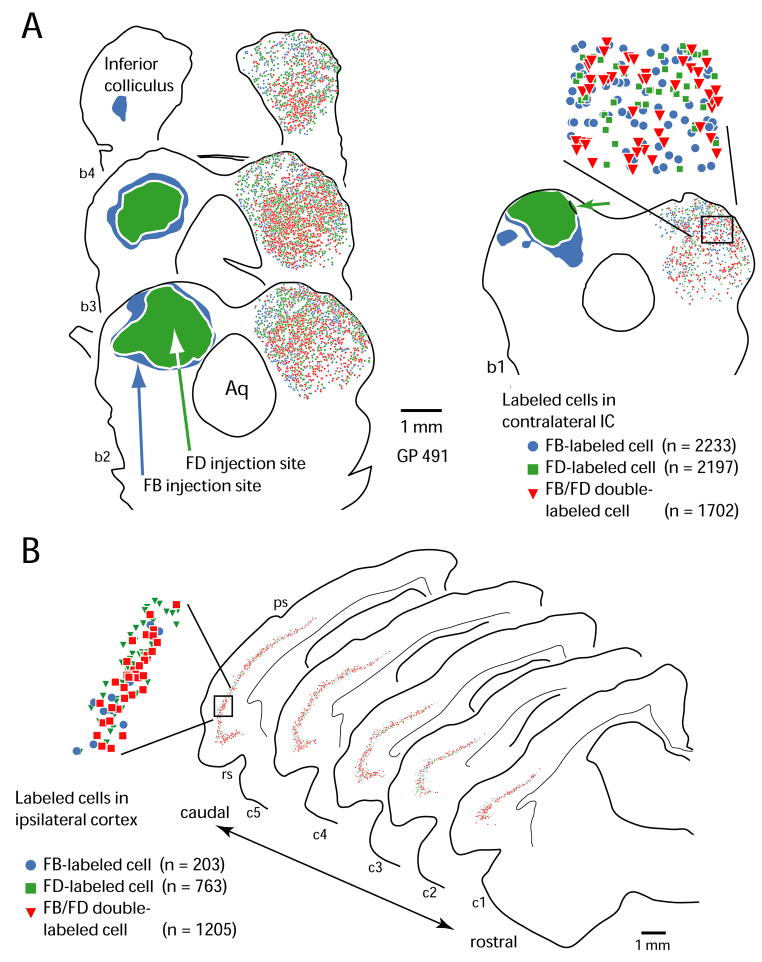
Figure 1.
Plots showing an injection site and distribution of analyzed cells in a representative case (GP491). A. Drawings of transverse sections through the midbrain; sections are numbered from rostral to caudal (b1 – b4). Sections are spaced 300 μm apart. A mixture of Fast Blue (FB) and fluorescein dextran (FD) was injected into the left IC; the distribution of each tracer is shown by the filled contours. The FB diffused farther than the FD except in one small area (green arrow in section b1). The right IC in each section contains colored symbols, each of which indicates a single cell labeled as described in the legend. The area within the box in section b1 is shown in the inset to illustrate the intermixing of cells with different labeling patterns. The number of labeled cells (n) is shown for each type in the legend. B. Plots of labeled cells in the ipsilateral temporal cortex in the same case illustrated in A. Conventions as in A. Legend lists numbers of labeled cells in the cortical sections. Aq – cerebral aqueduct; ps – pseudosylvian sulcus; rs – rhinal sulcus

