
Figure 3.
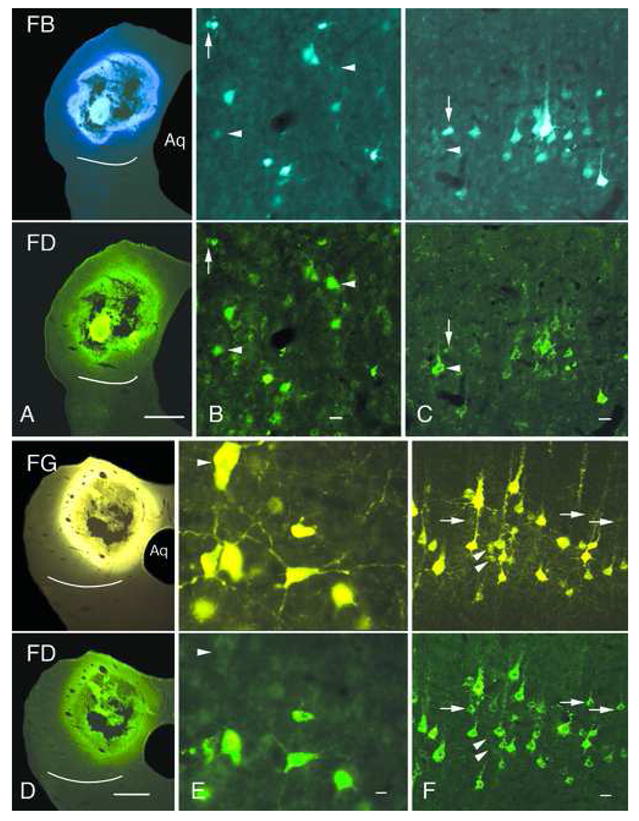
Photomicrographs of injection sites and retrogradely labeled cells after co-injections of Fast Blue (FB) and fluorescein dextran (FD) (A–C) or FluoroGold (FG) and FD (D–F). AC. Each pair of images shows an area viewed with filters for FB (top panel) or FD (bottom panel). A. Injection site in the left inferior colliculus (white line indicates ventral border of the inferior colliculus). Dorsal is up; lateral is to the left; midline is located at the right edge of the image. B, C. Labeled cells in the right inferior colliculus (B) or left temporal cortex (C). Cells are double- or single-labeled. Arrows: cells that contain only FB; arrowheads: cells that contain only FD. D. Injection site in the left inferior colliculus (white line indicates ventral border of the inferior colliculus). Dorsal is up; lateral is to the left; midline is located at right edge of image. E, F. Labeled cells in the right inferior colliculus (E) or left temporal cortex (F). Cells are double- or single-labeled. Arrows: cells that contain only FD; arrowheads: cells that contain only FG. Scale bars: 1 mm (A, D); 10 μm (B, C, E, F). Aq – cerebral aqueduct. Cases GP491 (A); GP489 (B, C); GP490 (D–F).