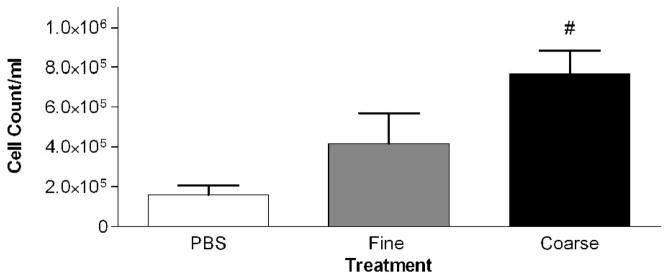
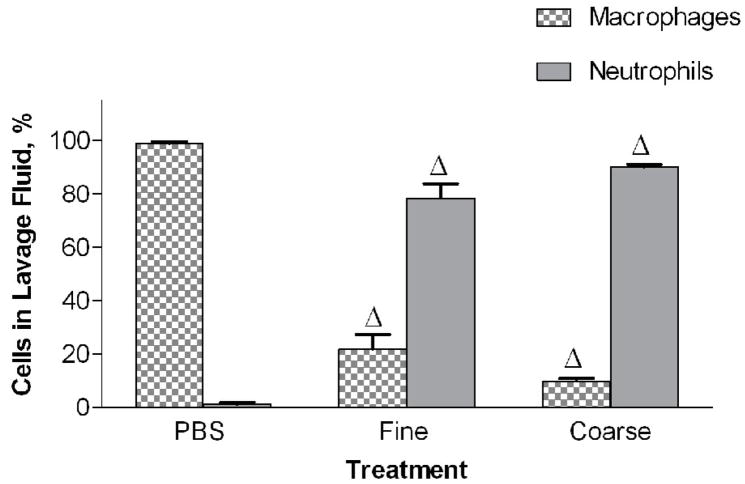
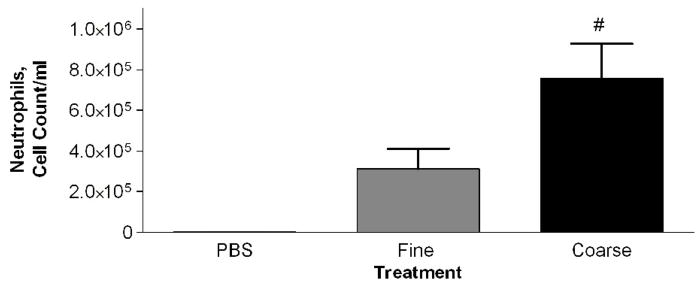
Figure 2a-c.
a) Total cell count of recovered cells in lung lavage fluid 24 hours after instillation of PM2.5 or PM2.5–10 (# P<0.001). b) Percentage of macrophages (checkered bars) and neutrophils (dark bars) in lung lavage fluid 24 hours after instillation of 50ug of PM2.5 or PM2.5–10 (ΔP<0.0001). c) Number of neutrophils in lung lavage fluid 24 hours after instillation of PM2.5 or PM2.5–10 (# P<0.001). Data are shown as mean values ± SEM.


