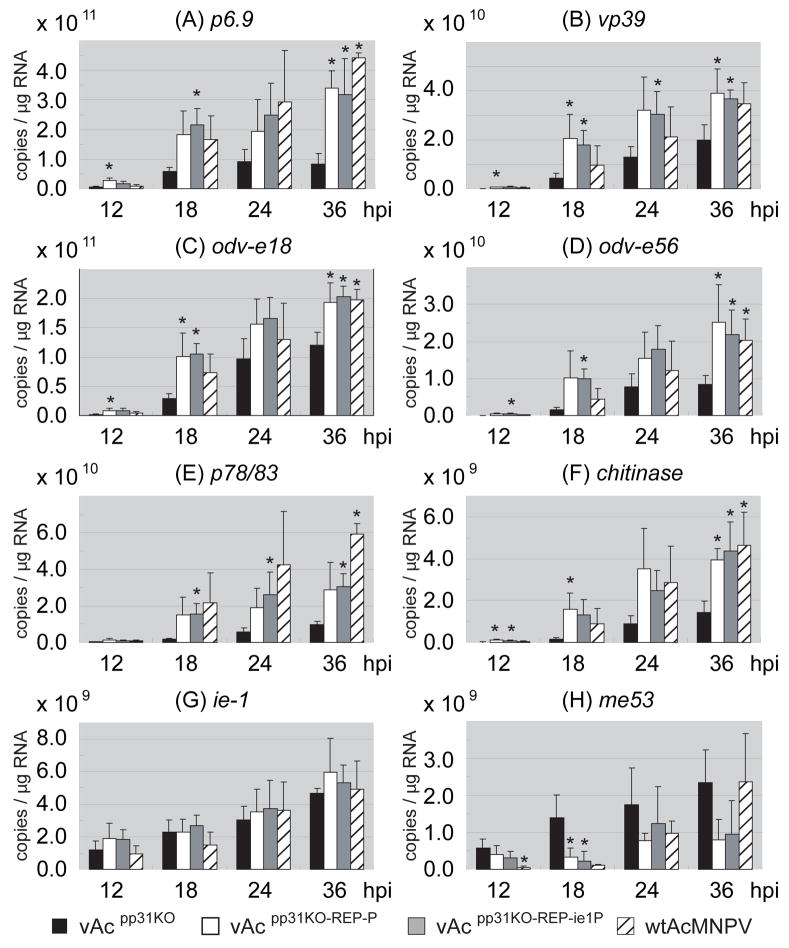
Figure 4.
Quantification of transcripts from selected viral genes [p6.9 (A), vp39 (B), odv-e18 (C), odv-e56 (D), p78 (E), chitinase (F), ie1 (G) and me53 (H)] by qRT-PCR. For each graph, the vertical axis indicates the number of transcripts estimated from 1 μg poly(A)+RNA purified from infected Sf9 cells. Infections were performed in triplicate at an MOI of 5 and poly(A)+RNAs were purified and assayed in triplicate. Average qRT-PCR data was derived from 9 data points for each time point post infection (n=9). Error bars represent the standard deviation from the mean. Statistically significant differences between the pp31 knock out and control viruses are indicated by asterisks (* P <0.05).

