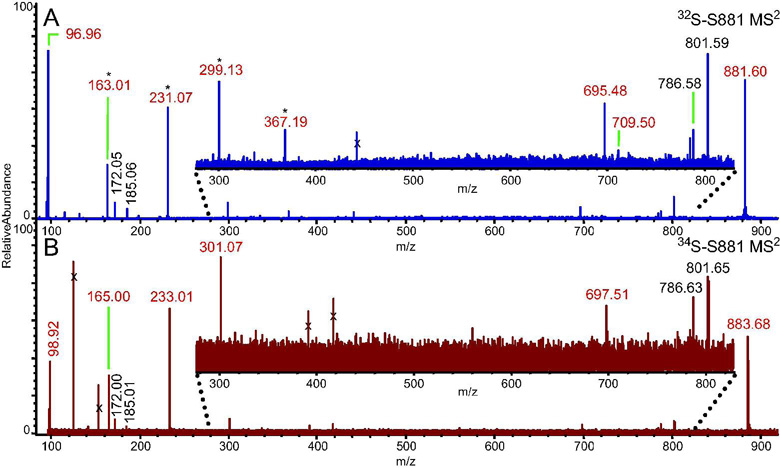
Figure 1. MS2 FT–ICR mass spectra of S881.
Ions marked with an “x” were not ejected from the ICR cell prior to activation of the parent ion, and are therefore not dissociation ions of S881. Ions in red are sulfate–containing dissociation ions (Table S2). A) The MS2 FT–ICR mass spectrum of S881. Ions separated by 68 mass units are denoted by an asterisk. B) The MS2 FT–ICR mass spectrum of a 34S–labeled S881. The sulfate–containing dissociation ions are shifted by two mass units compared to the dissociation ions of the 32S–S881.

