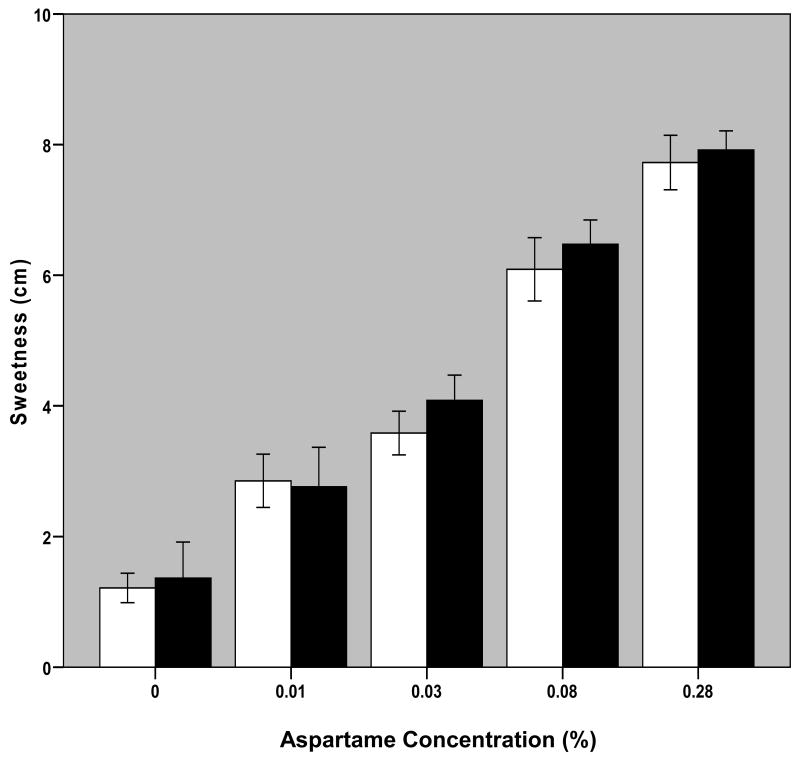
Fig. 5. Perceived Sweetness as a Function of Aspartame Concentration in Solution.
Bars represent mean +/- S.E. of self-reported sweetness ratings of solution at each aspartame concentration averaged over the three trials for 11 BN and 10 NC participants. Blank bars are for NC and black bars are for BN subjects.

